


Like everyone, we love stories.
So we gave a shot at humanizing this technical piece through storytelling.
We’re going to take a dive into John’s life as a data scientist in a manufacturing firm and how his curiosity introduced him to the benefits of data science that made life easier for the manufacturing workforce, teams, and customers.
It all began when John’s manager approached him with concern. He had been noticing a spike in the number of repair complaints of a specific product that his company had launched recently. It had started to take a toll on not just the credibility of their brand name, but also the pressure on the customer servicing team, the repair team and the reliability customers needed to help on their decision making.
He started brainstorming the many ways of creating a system that could predict the next complaint. He realized if he could arrive at a solution it could really help with his company’s operational efficiency and earnings.
John would constantly analyze the possibilities of prediction and with some mathematical inspiration, John inferred that any problem could be resolved in ‘N’ number of ways, so why not start there?
And that’s when he stumbled across MTBF which not only saved the day, but probably earned him a promotion too.
With MTBF he was able to predict the next possible failure, not just the next complaint. That unplanned insight was able to resolve a huge revenue leak for his company.
But what is MTBF?
.png?width=600&name=unnamed%20(6).png)
MTBF stands for ‘mean time between failures’. It is the predicted elapsed time between inherent failures of a mechanical or electronic system during normal system operation.
In plain English, it is how often an asset may fail while in normal operation. Went over your head? Don’t worry, we’ve broken it down here for you:
.png?width=600&name=unnamed%20(5).png)
.png?width=311&name=unnamed%20(4).png)
Using the complaints data, John was able to draw structure to the data:
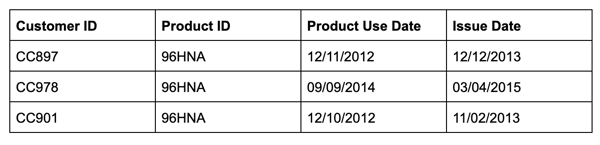
He started out with calculating the uptime of an individual product:
Uptime = Subtract (issue date, product use date)
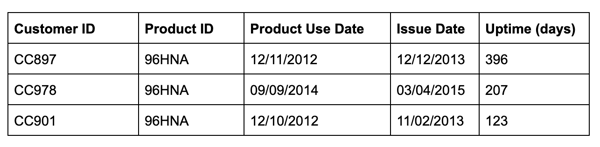
And using the MTBF formula, John was able to arrive at:
MTBF of Product with ID 96HNA = 242 days. In simple words a derived approximate of how long it would take for a particular product to fail.
MTBF = sum of uptime / no of failures
MTBF = (396 + 207 + 123) / 3
In working out the uptime of product ‘A’ (with ID 96HNA) John was able to get some valuable insights that helped his team to plan around future complaints.
And that’s small. See how MTBF is changing things up in the manufacturing world.
How statistical data (MTBF) is helping in the manufacturing world
Statistical data can help with risk analysis, better maintenance, and increased longevity of products or components across different industries.
.png)
Statistical data helps companies make proactive decisions
Making business decisions is no easy task, but to make decisions around costly equipment can be all the more stressful. But what if you had the data to make an easy call between a replacement or cost of repair? That’s where the MTBF metric can help make tough decisions easier.
Customers look for reliability from companies:
Customers today like making informed decisions. And that’s where statistical data like MTBF can really help. Customers want companies to share that information at their decision-making phase. Customers perceive the product quality to be better when the time between failures is higher.
With smarter predictions, companies deal with fewer surprises
These metrics also are a big help in keeping tech teams geared and ready. They’re able to be proactive in servicing and addressing product quality issues before they get too problematic. In being able to predict the next failure, they’re able to bounce back sooner and smoother.
Softway can help you humanize these hard technicalities
We’ve made it our mission to humanize technology across every digital touchpoint of our customers. So when we create solutions we take an empathetic approach. We step into the shoes of our users and work out thought-through solutions for every human that interacts with those tools, products, or interfaces.
Here’s where we dive deep into solving user and workforce problems and how working out those solutions tie into your end goals. We study different statistical and machine learning techniques that help understand user behaviour and characteristics of products in an intuitive way to create some quick and customized solutions.
Take a look at a few projects we recently completed that put a humanizing touch on the technology we created.
Ready to start your adventure with us? Let’s get started.

Shout-out and thanks to Gagan H N for helping me with this article!